Global trade in 2026: distinguish forecasts from disruption scenarios
The WTO’s March outlook paired a baseline with an energy-price shock. Those are different statements about the future.
The dated outlook
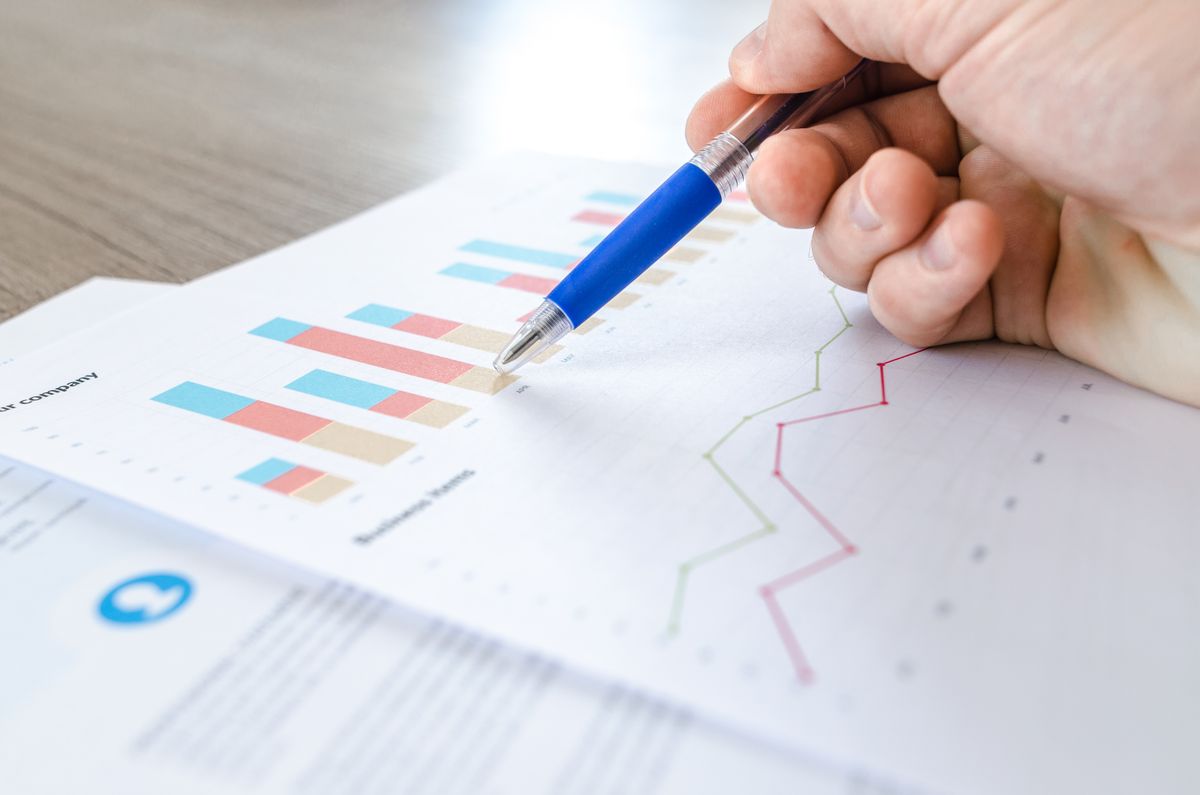
On March 19, 2026, the WTO forecast merchandise-trade volume growth of 1.9 percent for 2026 in its baseline. Its higher-energy-price scenario put growth at 1.4 percent. These were projections, not final trade results. The difference illustrates why a report should state the scenario attached to a number instead of selecting whichever percentage makes the most dramatic headline in a later month.
Volume is not value
A shipment can become more expensive without containing more goods. That is why trade volume and trade value answer different questions. If energy prices rise, money spent on imports can increase even while physical quantities weaken. When a story says trade is booming or collapsing, identify the measure before accepting the description. Currency movements and prices can substantially change the monetary total without a matching change in activity.
Follow the relevant route
A retailer importing household goods needs a different dashboard from a software exporter. One may care about shipping schedules and border procedures; the other about contracts, payment access, and customer demand. Start by listing the route, product, customer, and settlement currency. Then identify which disruption could interrupt that chain. A broad global forecast provides context, but practical exposure is located in specific relationships and often depends on timing.
Build a compact supplier check
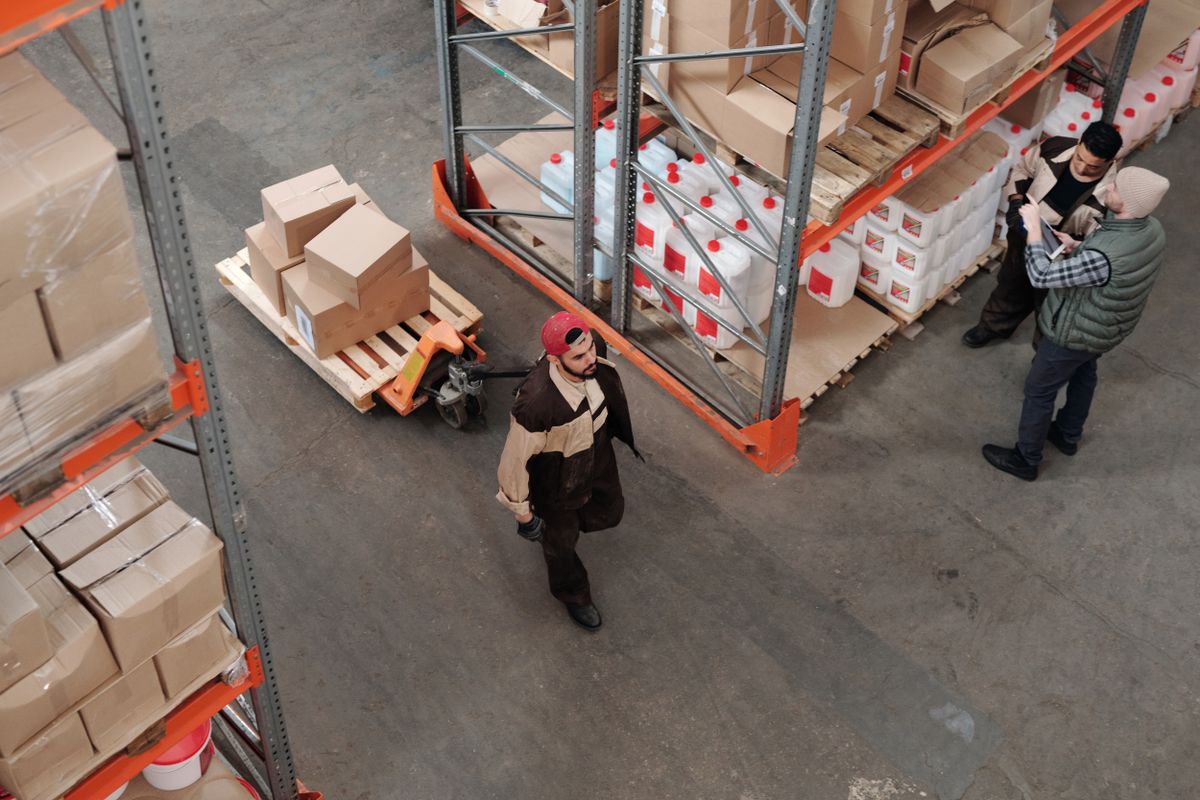
Ask suppliers about delivery windows, alternate origin options, minimum orders, and how additional freight costs are allocated. Record answers in writing. If an alternative supplier uses the same port or input source, it may provide less diversification than it appears to. A second logo on an invoice does not automatically mean an independent supply chain. The useful test is whether the backup continues to operate under the shock you are considering.
Consider services separately
Goods are highly visible in trade coverage because ships and containers make compelling images. Services can face different constraints, including travel, licensing, data rules, and client spending. Keep these channels separate when interpreting an aggregate. A decline in passenger travel need not imply the same pattern for remotely supplied work. Likewise, a strong digital-services business cannot establish that the local manufacturers serving a different market are enjoying comparable demand.
What to watch next
For a current assessment, look for updated official trade releases and compare them with this March baseline. Track the same definition and period each time. Avoid turning a single late shipment into proof of a global trend, or a global improvement into certainty about a specific order. A useful trade report connects the aggregate outlook with the concrete channels through which customers, workers, and firms experience changes.
Sources & further reading
Source links support the factual context. Practical examples and suggested workflows are original editorial guidance. Sources checked October 5, 2026.
Spotted something we should correct? Send a correction. Read our editorial policy.